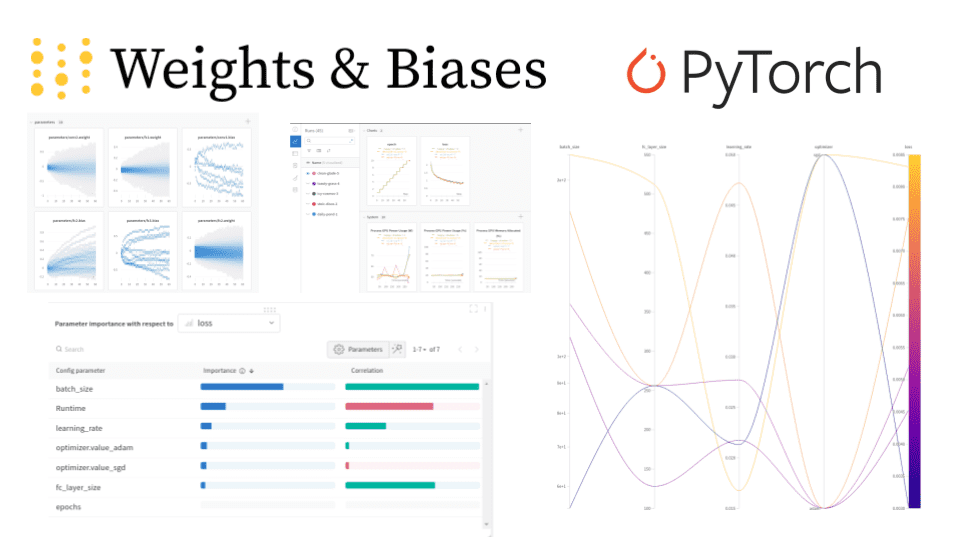
Weights and Biases has become one of the AI community favourite libraries. The team has done an excellent work creating a platform where the Machine Learning engineer can effortlessly:
Track his/her experiments
Visualize the training process
Share the results with the team
Improve the model’s performance
Personally I started using it a couple of months ago and quickly became an individual part of all my projects. This article summarizes my experience with the library and aims to be a self-complete tutorial of its most useful features. To accomplish that, we will examine how we can integrate the wandb library in a new project.
Shall we begin?
Prerequisites
We will use a standard Deep Learning model that performs image recognition on the CIFAR10 dataset. The model doesn’t really affect our experiments so I thought to keep it as simple as possible. The model will be trained on the dataset from scratch in order to explore how we can utilize the wandb library.
Here is the Pytorch code for our model alongside with the data processing :
import torchimport torch.nn as nnimport torch.nn.functional as Fimport torchvisionimport torchvision.transforms as transformstransform = transforms.Compose([transforms.ToTensor(),transforms.Normalize((0.5, 0.5, 0.5), (0.5, 0.5, 0.5))])trainset = torchvision.datasets.CIFAR10(root='./data', train=True,download=True, transform=transform)trainloader = torch.utils.data.DataLoader(trainset, batch_size=4,shuffle=True, num_workers=2)testset = torchvision.datasets.CIFAR10(root='./data', train=False,download=True, transform=transform)testloader = torch.utils.data.DataLoader(testset, batch_size=4,shuffle=False, num_workers=2)class Net(nn.Module):def __init__(self):super(Net, self).__init__()self.conv1 = nn.Conv2d(3, 6, 5)self.pool = nn.MaxPool2d(2, 2)self.conv2 = nn.Conv2d(6, 16, 5)self.fc1 = nn.Linear(16 * 5 * 5, 120)self.fc2 = nn.Linear(120, 84)self.fc3 = nn.Linear(84, 10)def forward(self, x):x = self.pool(F.relu(self.conv1(x)))x = self.pool(F.relu(self.conv2(x)))x = x.view(-1, 16 * 5 * 5)x = F.relu(self.fc1(x))x = F.relu(self.fc2(x))x = self.fc3(x)return x
The first step is to install the library and create a new account.
Installation and initialization
If you haven’t already, you will need to create a new account in order to be able to use Weights and Biases. The library is free for personal use but comes with a monthly price for teams. You can visit the website and sign up.
Once you do that, you should be able to install it using pip or conda. After installing, you will need to authenticate yourself. This can be done with the wandb login command. You will be prompted to copy paste an authorization key in order to continue.
$ conda install -c conda-forge wandb$ wandb login
The library can be initialized in our code with the init method which receives an optional project name and your username, among other things.
import wandbwandb.init(project='test', entity='serkar')
Now that we are all set up, let’s try and integrate the library to our training loop.
Experiment tracking
The main use of the wandb library is to track and visualize the different machine learning experiments, the training process, the hyperparameters and the models. Let’s see some examples.
Track metrics
The amazing thing about the Weights and Biases (W&B) library is how easy it is to use. In many cases, it is literally one line of code:
wandb.log({'epoch': epoch, 'loss': running_loss})
The .log() command will capture all the arguments and send them to the W&B instance. This will allow us to access and track them from the UI. You can find the dashboard in the W&B website under your project.
In our application, a sample training loop can look like below:
for epoch in range(10):running_loss = 0.0for i, data in enumerate(trainloader, 0):inputs, labels = data[0].to(device), data[1].to(device)optimizer.zero_grad()outputs = net(inputs)loss = criterion(outputs, labels)loss.backward()optimizer.step()running_loss += loss.item()if i % 2000 == 1999: # print every 2000 mini-batchesprint('[%d, %5d] loss: %.3f' %(epoch + 1, i + 1, running_loss / 2000))wandb.log({'epoch': epoch+1, 'loss': running_loss/2000})running_loss = 0.0print('Finished Training')
Did you notice the wandb.log line? That way, we can inspect the training process in real time. The result will look like this:
![]()
Pretty awesome, right?
Another command that can also be used is the wandb.watch, which will automatically collect the model’s gradients and the model’s topology.
wandb.watch(net, criterion, log="all")
Besides the defined metrics, we can also track many other useful things such as our trainable parameters.
![]()
Or the gradients:
![]()
One other feature that really impressed me is the system dashboard. There, we can inspect our hardware and how the different components behave during training. For example, one can examine the CPU, GPU, memory utilization, power usage, temperatures and more.

Each time we execute our training script, a new “run” is created and appended to the project’s history. Each “run” contains the logged information with different metadata. We can, of course, explore all the different runs in a single dashboard.

Track hyperparameters
Besides metrics, W&B has another neat functionality that enables us to track the hyperparameters of our training. The wandb.config object is used to save the training configuration such as hyperparameters. But it’s not limited to them. We can essentially store every piece of information we want. Examples include: dataset names, model types and flags.
A config can be initialized like this:
config = wandb.configconfig.learning_rate = 0.01config.momentum = 0.9
For complex configs, we can also use a yaml file or a python dictionary.
All these values can be used to analyze the experiments and reproduce the results. In the following dashboard, we can see five “runs” with their hyperparameters. Note that we can use the config values to group, filter or sort them.
![]()
Visualize model
If we use the aforementioned watch command, we can also inspect the model’s topology in the model dashboard. In our case, the model will look like this:

Inspect logs
The same is true for the actual logs printed in our local console:

Data and Model Versioning
Besides experiment tracking, W&B has a built-in versioning system. Artifacts are the main entity towards that goal. Artifacts enable dataset versioning, model versioning and dependencies tracking.
An artifact is nothing more than a versioned folder of data. Let’s examine an example using our project. In order to version our dataset, all we have to do is create an artifact and upload it.
cifar10_artifact = wandb.Artifact("cifar10", type="dataset")file_path = './data/cifar-10-batches-py'cifar10_artifact.add_dir(file_path)run.log_artifact(cifar10_artifact)
You can imagine that something similar can be done for versioning the model or the dependencies. It is worth mentioning that instead of using the whole dataset, we can create an artifact with an external reference of the object as below:
artifact.add_reference('s3://my-bucket/my_dataset)
Download and using an already uploaded artifact in our code is also straightforward:
artifact = run.use_artifact('cifar10_artifact')artifact_dir = artifact.download()

Hyperparameter Tuning with Sweeps
Weights & Biases Sweeps is a tool to automate hyperparameter optimization and exploration. It eliminates most of the boilerplate code and comes with super nice visualizations. Let’s explore how we can utilize Sweeps in our projects.
In our use case, we want to tune 4 different parameters: the size of the last linear layer in the model, the batch size, the learning rate and the optimization algorithm. To achieve this, we first need to create a configuration with the different options. Here is a sample config:
sweep_config = {'method': 'random','metric': {'goal': 'minimize', 'name': 'loss'},'parameters': {'batch_size': {'distribution': 'q_log_uniform','max': math.log(256),'min': math.log(32),'q': 1},'epochs': {'value': 5},'fc_layer_size': {'values': [128, 256, 512]},'learning_rate': {'distribution': 'uniform','max': 0.1,'min': 0},'optimizer': {'values': ['adam', 'sgd']}}}
First we define the tuning method which is the search strategy. We have 3 options: random, grid search and bayes search. The metric is the end goal that should be minimized. Finally the parameters refer to the hyperparameters to be searched by Sweeps. As you can see we will tune the following:
The batch size to be in the [log(32), log(256)] range. The selection of the batch size will follow the quantized log uniform distribution. Other choices are available as well.
The number of epochs to always be equal to 5.
The size of the last linear layer to be 128, 256 or 512.
The learning rate to be in the [0, 0.1] range following the uniform distribution
The optimizer to be SGD or Adam.
Sweeps will try all different combinations and calculate the loss for each one. Sweeps can be initialized using:
sweep_id = wandb.sweep(sweep_config, project="test")
The training loop should then be transformed to read from the predefined config. Take a look at the following code:
def train(config=None):with wandb.init(project='test', entity='serkar', config=config):config = wandb.configtransform = transforms.Compose([transforms.ToTensor(),transforms.Normalize((0.5, 0.5, 0.5), (0.5, 0.5, 0.5))])trainset = torchvision.datasets.CIFAR10(root='./data', train=True,download=True, transform=transform)trainloader = torch.utils.data.DataLoader(trainset, batch_size=config.batch_size,shuffle=True, num_workers=2)testset = torchvision.datasets.CIFAR10(root='./data', train=False,download=True, transform=transform)net = Net(config.fc_layer_size)net.to(device)criterion = nn.CrossEntropyLoss()optimizer = optim.SGD(net.parameters(), lr=config.learning_rate)if config.optimizer == "sgd":optimizer = optim.SGD(net.parameters(),lr=config.learning_rate, momentum=0.9)elif optimizer == "adam":optimizer = optim.Adam(net.parameters(),lr=config.learning_rate)wandb.watch(net, criterion, log="all")for epoch in range(config.epochs): # loop over the dataset multiple timesrunning_loss = 0.0for i, data in enumerate(trainloader, 0):inputs, labels = data[0].to(device), data[1].to(device)optimizer.zero_grad()outputs = net(inputs)loss = criterion(outputs, labels)loss.backward()optimizer.step()running_loss += loss.item()print('[%d, %5d] loss: %.3f' %(epoch + 1, i + 1, running_loss / len(trainloader)))wandb.log({'epoch': epoch + 1, 'loss': running_loss / len(trainloader)})print('Finished Training')
Two things to notice here:
The training loop is being wrapped with
with wandb.init(project='test', entity='serkar', config=config). That's another way to bind the W&B library with our code.We read the config using
config = wandb.configand then we pass each parameter in the training code. We have to make sure that the hyperparameters used come from the config file in order for Sweeps to be executed properly.
Finally we can execute the tuning with the below command.
wandb.agent(sweep_id, function=train, count=5)
This instructs Sweeps to run the train function only 5 times choosing 5 random combinations of hyperparameters. The results are illustrated below:

Notice that we acquire the best results for the following set of hyperparameters:
Batch size = 55
Linear layer size = 256
Learning rate = 0.02131
Optimizer = SGD
Using this combination, the loss became equal to 0.003.
Another very cool chart is the following one:

Here we examine what parameters have the higher impact in the loss and how. This is called the hyperparameter importance plot. It indicates which hyperparameters were the best predictors of our metrics. The feature importance is derived using a random forest model and the correlation using a linear model.
Data visualization
Another feature that I’m really enjoying is data visualization. W&B let us define a table of data and visualize it on the platform. The table can consist of almost anything: data such as images, text or audio, gradients, trainable parameters, etc. Besides visualization, we can also filter, sort, group and in general explore the data.
To make that clear, we will present a simple example. Let’s create a small table with all the images from the first batch of our data and their labels. Creating a table can be done using the wandb.Table class. To sync the table, we will have to log it.
classes = ('plane', 'car', 'bird', 'cat','deer', 'dog', 'frog', 'horse', 'ship', 'truck')columns=['image','label']data = []for i, batch in enumerate(trainloader, 0):inputs, labels = batch[0], batch[1]for j, image in enumerate(inputs,0):data.append([wandb.Image(image),classes[labels[j].item()]])breaktable= wandb.Table(data=data, columns=columns)run.log({"cifar10_images": table})
Note that we use the built-in data type wandb.Image so that we can preview the image. Once we run the above code, we can inspect our table in the dashboard.

You can imagine that using the same logic, we can visualize practically anything.
Reports
Finally, I want to close this tutorial with a feature that is targeted more towards teams. Reports. Reports enable us developers to organize the different visualizations, communicate our results and document our work.
W&B provides a WYSIWYG editor with a plethora of features. It supports markdown and latex for text, code snippets, as well as a variety of other charts. Examples include: line plots, bar plots, scatter plots and more. The team is working hard to add more functionalities such as embedded videos, html, audio and more.

The reports can be shared and edited by other people enabling full collaboration among our peers.
Conclusion
And that concludes our journey in the Weights and Biases library. W&B has become one of my personal favorites and has improved my workflow a lot. I highly recommend you try it out if you haven’t already. More details you can find in their documentation, which is very well written. Many examples are also provided in their Github repository.
Have fun playing around with it. Let us know if you have any questions or if you want us to cover W&B in more detail in the future. As always, please share this article if you find it useful. It really matters for us in order to keep writing content.
* Disclosure: Please note that some of the links above might be affiliate links, and at no additional cost to you, we will earn a commission if you decide to make a purchase after clicking through.